
Ideas
- Ahseek Naseeb

- Oct 16, 2020
- 2 min read
I usually have a lot of difficulties to focus while doing analysis and all that. So, this time I wrote down what data was important to support my infographic and that will connect to my observation.
So I want to see 'How close are we to live in a world without plastic'
here's a list of the important things to include in the infographic:
From survey
In 149 people
How much people are concerned
How much they believe in bioplastic
How many will support bioplastic
How many do things that diminish their usage of plastic
How many people recycle
From observation
In 1 household
How many plastic product
How many amongst those does not look suitable to be made from bio plastic.
How many already have their alternatives made from another material
And this is my observation which I made and categorized the items as follows. I also listed a few item that was made of plastic but there exist an alternative on the market like for example the product is made of wood or glass instead. And I also listed how many of those items will be able to be replaced by the bioplastic that already exists. A few things like plumbing pipes and electronics like laptop ect, I did not find possible to replace with bioplastic because bio plastic is made to degrade and those things need to be very durable and last for years.

After that I tried to sketch a few ideas

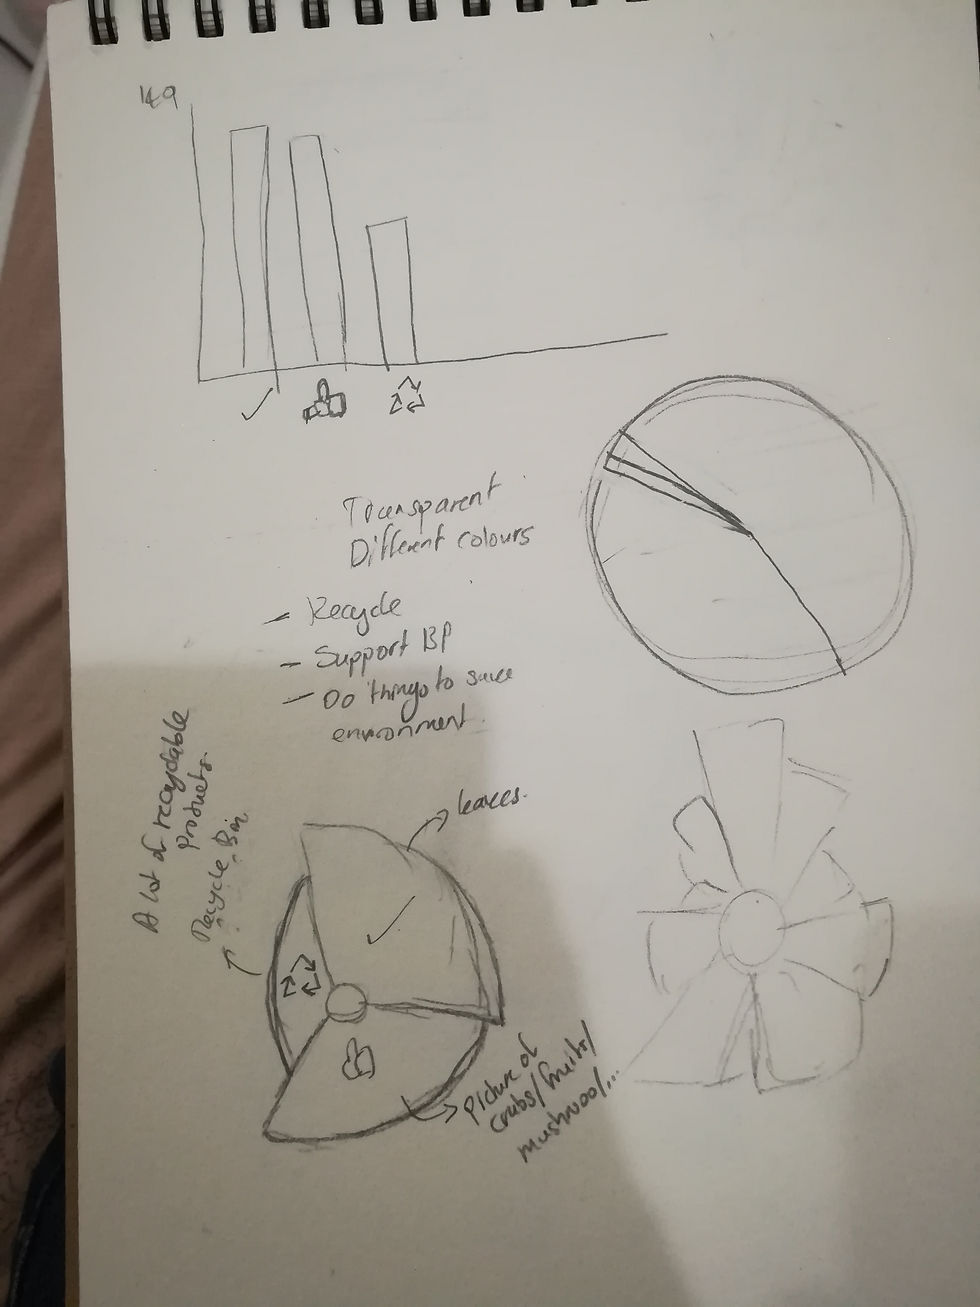
Later on I also got the I got the idea to try to insert photography in the shape that will represent the data because from my observation all the objects listed down are in my home and I can just make an arrangement with them and take a picture and fit them in the shape. I could also do something similar for the data from my survey like maybe use leaves for how many do things that protects the environment.


Comments