Hidden Plastics
Infographic
Sorting Out Data
After making the research and the experimentation, I started sorting our which data I find more crucial for my infographic and will better lead the audience to a similar conclusion to what I found. I also had to find which data I could group together. I listed them down as follows:
From the survey
In 149 people:
-
How much people are concerned.
-
How much they believe in bioplastic.
-
How many will support bioplastic.
-
How many do things that diminish their usage of plastic.
-
How many people recycle.
From the observation study
In 1 household:
-
How many plastic product.
-
How many amongst those does not look suitable to be made from bio plastic.
-
How many already have their alternatives made from another material.
Ideas
I then tried to sketch a few ideas, merge some information with others and created a few graphs. I was thinking to try to insert photography in the shape that will represent the data because from my observation all the objects listed down are in my home and I can just make an arrangement with them and take a picture and fit them in the shape. I could also do something similar for the data from my survey like maybe use leaves for how many do things that protects the environment.


The sketches seems ok so I went on Illustrator and did the graph with proper scaling to build on top of it in photoshop.


Making Of Photographic Graphs
I started taking pictures and placing them onto photoshop to edit. The first few I had to make a lot of correction as I was still not completely used to the proportion on digital and in real life. Here is how I corrected some images.


I also tried to input the data onto the images the way I did in my exercise with the food wastes infographic, but for this one it was not working out well, so I decided to used dotted lines instead as it was not obstructing the images too much and it seemed to be working well with the photographic graph.


After having a clearer vision of how I could display the information, I went ahead and completed the photographic graph. The other images were easier to edit as I was able to adapt to the scale of real life and digital and this helped me to strategize my arrangement better so that I will not have too much to edit on photoshop. After finishing the graph I went on Illustrator again to add the dotted lines so that I would have more control over the scale for the percentages.


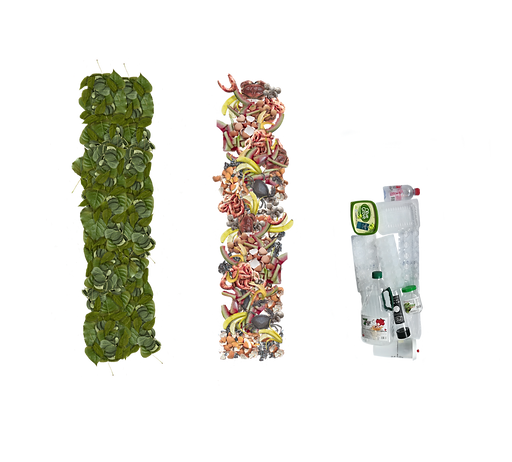
For the bar chart, I decided to use leaves to represent how many people do ecofriendly practices and use food wastes from my research to represent bioplastic. However, I could not use my own pictures because I did not have the objects/ materials for the bioplastic and it would have become expensive and time consuming to buy for the limited time and tight budget I had, so I decided to use stock images from the internet. It made my photoshop file become really heavy and I had to split the file but it was ok in the end. As for the "how many people recycle" part I used my own arrangement of recyclable objects I had with me just like I did for the circular graph.
After that, the last graph, was the hardest to get an idea for the photographic part. At first, I thought because it was a graph that represents people's thoughts, I could make it with hair. And I actually went on with the trouble of making the graph with hair and it was really painful with photoshop.

Layouts
After that I moved on to making the layouts and trials for the background for the infographic. Below are my disgusting ugly preliminary trials. With those I realized that white is a better background for the infographic, however the hair graph does not work out at all together with the other graphs. It does not look good at all and it is also weird to suddenly have hair while the others are objects.


I decided to change the hair graph I decided to replace it with electric wires. The data looked more accurate and also looked better.
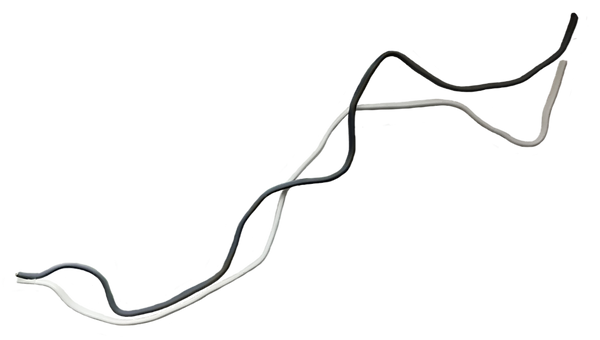
After that I went on playing with different layouts again, but this time, I made the layouts carefully and neatly because I already had some ideas in mind for the final infographic. The wires did look a lot better in the infographic compared to the hair. I also did some trials for the font for the main title, and I chose the one that looked better in terms of spacing and overall look.


Hidden Plastics
The next project was the fruit of the infographic. It all started when I obtained feedback that the plastic object from the observation study could be better displayed and that the study could be from different households instead of just 1. I also found this to be a great direction to go to as from my research, I found that bioplastic can replace single use plastics mostly, as for other things that were meant to last for a longer period of time like water pipes for example, it might not be very suitable. But these non single use plastic items also ends up in landfills one day. So it would be better to inform or just remind people about our high consumption of plastic as a way to sensitize them.
As for the piece, I wanted it to be an interactive piece as studies has proven that experiential learning is a better and easier way for people to learn or just get informed. (Pimentel, J. 1999).
Ideas
After making some more research by interviewing several households about their plastic consumption, I sketched out some ideas. The main concept is to make a model of an apartment and display the amount of plastic products that is used by that particular family. I have also gotten the idea use AR to make it interactive. I also thought of maybe try making it like a campaign but the idea was not really great and I could not improve it either so it got rejected.


After that I also found out that AR was proven to be an effective way of teaching and learning by many studies (Garzón, J. et al. 2020). This is because of it's interactivity and how it allows people to see more that they can see in reality in interesting ways (A Review of Research on Augmented Reality in Education, 2015). So I went on learning AR which was a long process and I had to do several experimentations to get it right.
I had the idea to make the plastic objects in the model highlighted with the AR and make them clickable so that the audience can get more information on that particular object they have clicked on, so I had to work on making that work properly too.
I decided to put the items that were common and most used from the research instead of all the items that the people had, in the information piece and give people information about how widely they are used and what part of the object is plastic for items that contains micro plastic fibers. I also decided to make it a model of a living room as it is where the people had most of their common plastic items. After that I made a few sketches of how I wanted the space to look


Making Of the Model
Once I was able to make the AR work properly and had a clearer vision of what I wanted to do, I was sure that the model idea was achievable, So I started planning everything and I found out that glue are not ecofriendly and they contain plastic in them (Breyer, M., 2020). So I decided to make my own glue and I had to make some trials with them to see which glue will suit my project better. After that I had already made my first item and was ready to move on to the others.


The glue was working fine so I moved on to making the other items. I made an origami umbrella and I used a toothpick to make the shaft.


After that I made an internet modem or router, it was pretty tricky to make because I didn't watch any tutorial for this one and it was a struggle to glue as the organic glue did not dry fast.


And here are a few shots of arrangements I tried to make just for fun and to at the same time get some ideas for the final model.


Here's how I made the shoe which was also a tricky one as in the tutorial plastic items were used and I had to figure out how I could get my way around it without using plastic.


This is another origami I made which was very fun and easy and I was happy with the final result.


This is how the sofa was made. It was pretty easy as it was just boxes stacked together.


And here is another trial for the arrangement with all the objects I had at that moment.

I also made a broom and a dustpan. The dustpan was an origami which I glued another piece of paper at the bottom to hide the folds. For the broom, baking paper seemed like a proper material to use and I didn't forget to check if it was biodegradable on the packaging.


Lucky I had these bioplastic that I obtained from a parcel which I was able to use and make mini tissue paper in plastics.


I also tried to make mini stationaries, the pencil was harder to make because I was using a wood stick, my first trial failed but the final one turned out ok. I also did a small pen holder afterwards.


I also had to do some maths to make a cup and it turned out so small. The jug was also quite fun to make.


I had to make a small table for the living room near the tv and I found this pretty easy origami one that I thought would look good in cardboard. So I peeled a piece of cardboard and started folding. However even after peeling the cardboard it was still pretty hard to fold but the final turned out ok.


This is the TV and Router table I wanted to make. I did it by doubling the pieces of cardboard to make sure it will be tough. However it was quite a challenge to glue as again the eco glue doesn't dry fast.


And here is an other arrangement I tried with all the items for this part.


After that I had to make some printing to continue on so that I could make some more realistic objects.

I had this tv screen printed on a paper and glued on the TV to act as if it is turned on.


I had this mini remote control for the TV. I peeled the art card I was using to make it thinner but not so thin then glued the image of a remote on top of it and painted the other parts.


I also made this laptop which I am really happy with how it looks. For the back of the laptop, I had to paint it as I could not get a picture that matches the color I chose.


I then made this super duper mini phone done. It was quite a challenge because of it's size but in the end it looked nice.


And this pharmacy cabinet, I used it to represent all pharmacy products.


Those mini packaging were so fun to make, they're even smaller than my thumb. But they looked great.


And the last one printed are those electric sockets stuffs. For these also I peeled off the art card to get it to my desired thickness.

Then I made these stuffs as toys because a all the people I have interviewed had children and their children had a lot of toys. These 2 kind of act like plush toys that kids plays with but it's referring to all toys in general.


I also did this origami plant to act as decorative items in households and mostly fake plants and flowers.


Again here are some arrangement trails.


Then I made this dinning set. The table was pretty straight forward to make. However the chair I had to find another way to make it so that it would look more interesting without being too much of a hassle to repeat for another chair. I also decided to paint the wood textures on these ones because I had more control how it would look.


After that I did a few trials for the arrangement with items and when I found one that looked nice I went had to go out to make print the floor of my model, I also took this chance to buy a pretty nice textured blue paper that seemed like it would look good with the green lamp and the plant for a wall. So I glued the items together on the floor and I also used a 100% organic cotton sanitary pad to make the table cover and the carpet. I also glued the items in random positions because based on an article I read that reality is not well organized (Stine, D., 2018) and I also wanted to make the space look like people lived in there.


Next I got some 100% organic cotton strings to make the electrical wires and I really loved the final look.


And finally I glued the walls of the model which was a really hard process with the slow drying homemade glue, but once it dried it held up well.


Making the AR Part
Now onto the tracker, I took several pictures of the model from different angles. Logged in Wikitude and created an object tracker using object targets. Uploaded my images, waited patiently for some times, and the object tracker was done. Then I just transferred it to Unity to place the cubes for the highlights.


It was a pain to try to figure what was where with just the dots in unity, I tried to put the code that allowed me to move the cube on the app but it was hard as well, however in the end I ended up being able to read the dots and placed the cubes in their respective place well.


I then tried some layouts for the information that will be displayed when you click on the item on the AR app and here are some layouts I came up with.
Then I tried to figure out the proper scale and style for the information that will be displayed, it took several trials as the way Unity was set for the AR project, I could not preview how it would look on Unity itself. In the end I preferred the one with a window that allowed the audience to view what they have clicked on, and I set it up so that it the cube would disappear once clicked.


After that I used colors to categorize the object as it will allow the audience to quickly and easily identity which products are in the same categories (Wilke, C., 2019).
Making the Arrangement
Afterwards I made 2 A6 cards, 1 to explain about the project and give the audience instructions together with the keys for the color categories. And the other is a QR code to the google drive link to download the app for the AR experience.


And that is it, through this project I realized that we do not really have a choice to not use plastic or not because it is too widely used in many essential products.
Bibliography
2015. A Review of Research on Augmented Reality in Education: Advantages and Applications. 13th ed. [ebook] Canadian Center of Science and Education, pp.1,3. Available at: https://pdfs.semanticscholar.org/11c7/7089b13d02cf069fa0c665474fe34239b858.pdf [Accessed 24 February 2021].
Breyer, M., 2020. What Is Glue Made Of?. [online] Treehugger. Available at: https://www.treehugger.com/what-glue-made-4847390 [Accessed 24 February 2021].
Garzón, J. et al. (2020) ‘How do pedagogical approaches affect the impact of augmented reality on education? A meta-analysis and research synthesis’, Educational Research Review, 31. doi: 10.1016/j.edurev.2020.100334.
Pimentel, J. (1999). Design of Net-learning Systems Based on Experiential Learning. JALN, 3(2), 65. Available at: https://pdfs.semanticscholar.org/f489/6e0cd77e092eeb5bedd904aa953076103a0c.pdf [Accessed 24 February 2021]
Stine, D., 2018. 9 Ways to Make Your Renderings More Realistic. [online] ArchDaily. Available at: https://www.archdaily.com/901111/9-ways-to-make-your-renderings-more-realistic [Accessed 24 February 2021].
Wilke, C., 2019. Fundamentals of Data Visualization: A Primer on Making Informative and Compelling Figures. 1st ed. United States of America: O'Reilly Media, Inc., p.27.